
Host-to-container context
Start with server capacity and narrow the investigation to individual containers and their dependencies.
Container monitoring
Monitor Docker containers, CPU, memory, logs, ports, mounts, networks, and server resources from a native app for iPhone, iPad, and Mac.
Manage one server for free. Optional one-time Pro upgrade.
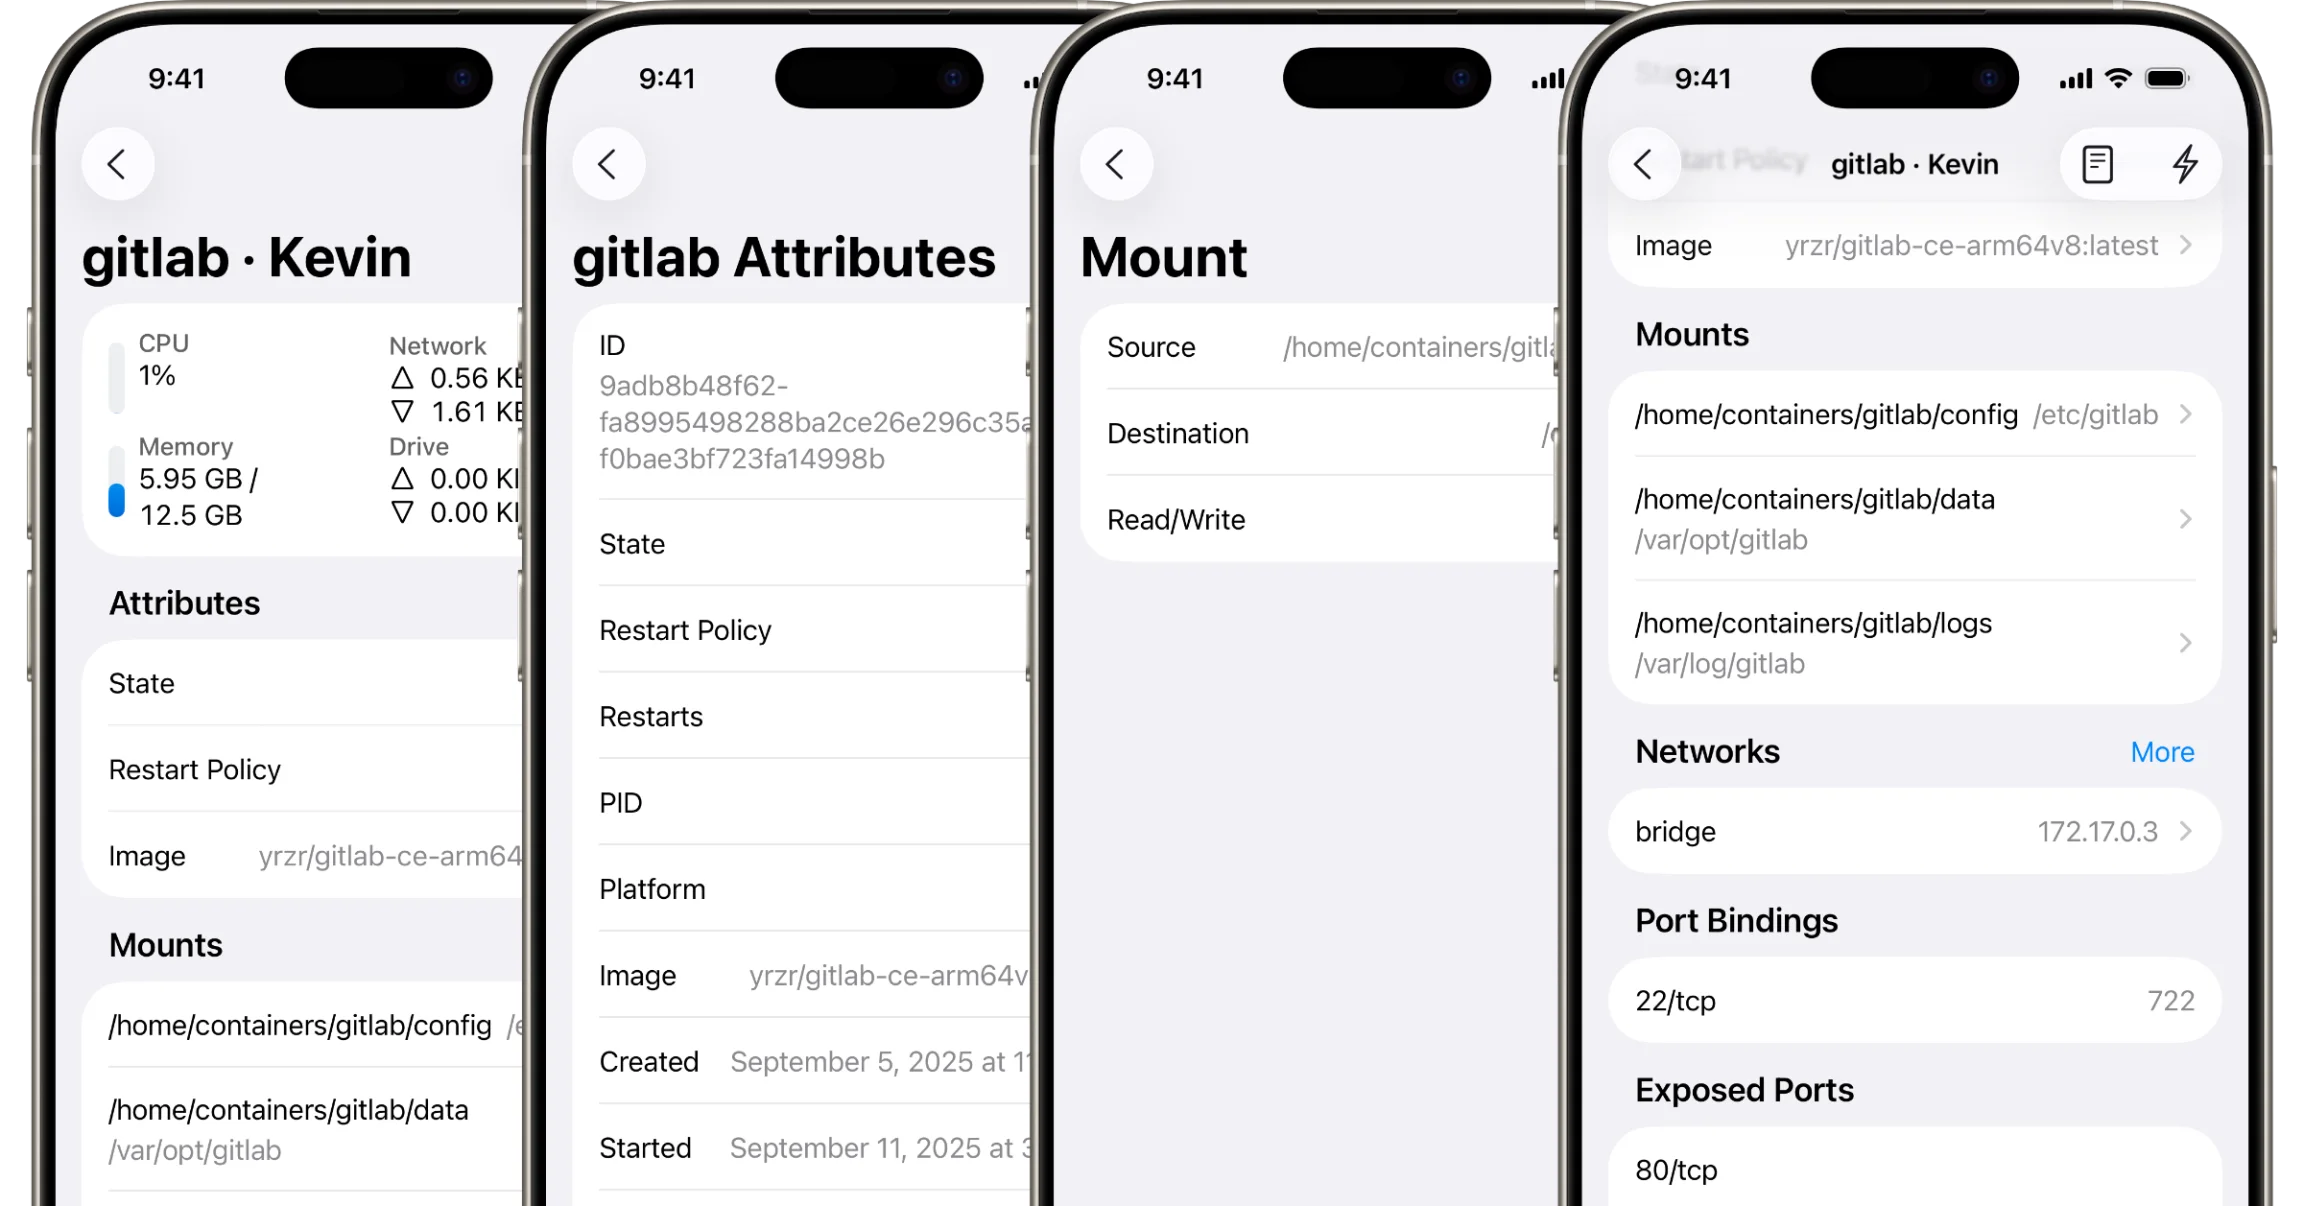
WhaleDeck provides current Docker container information across iPhone, iPad, and Mac. It combines server capacity, container state, resource usage, recent logs, and configuration relationships so an operator can investigate current conditions and take controlled action.
Container monitoring becomes useful when it leads to a decision. A list of green and red states is not enough if it cannot explain whether the host is under pressure, a dependency is missing, or the affected container is repeatedly restarting.
WhaleDeck focuses on current operational context. It brings current Docker information into a native Apple-platform interface and keeps the path from server overview to container detail short. It complements alerting and historical observability systems rather than attempting to replace them.
Start with server capacity and narrow the investigation to individual containers and their dependencies.
Compare lifecycle state and resources with logs, ports, mounts, image, network, and restart policy.
Use the same monitoring interface from iPhone, iPad, and Mac, with widgets for selected at-a-glance status.
A container can appear unhealthy because the underlying server is low on storage, under memory pressure, overloaded, or unreachable. Begin with host availability, uptime, aggregate CPU, memory, storage, and network activity. If several unrelated containers changed at the same time, investigate the shared host before restarting them individually.
Current metrics need workload context. A build can legitimately use high CPU, while a database may hold stable memory for performance. WhaleDeck helps expose the values; the operator still decides whether they are expected for that service and moment.
Running, exited, paused, and restarting describe process state, not complete application health. Open the container and review restart policy, recent logs, mapped ports, volumes, networks, and image. Then verify readiness through the workload health check, monitoring system, or a representative application request. This context helps distinguish an application error from a missing dependency or host problem.
Read evidence before changing state. A restart can clear a transient fault, but it can also rotate logs, hide the original condition, or interrupt a stateful workload. After acting, verify startup output and user-visible behavior rather than relying only on a running badge.
An iPhone is ideal for quick triage after an alert. An iPad provides more room for persistent status and detailed inspection. A Mac supports longer operational sessions. WhaleDeck keeps the resource model consistent across those devices, reducing the need to learn a different dashboard for each context.
Widgets can surface selected status between investigations, but operating systems control refresh timing. Use a real monitoring service for reliable probes, notifications, history, and escalation. Use WhaleDeck to understand the current Docker state and carry out the response.
Consistency matters during an incident. Check server status and capacity, scan container state, inspect the affected service, read logs, verify dependencies, choose a reversible action, and confirm recovery. This order prevents tunnel vision and produces better evidence for follow-up engineering work.
When the same issue repeats, improve the underlying system: health checks, resource limits, logging, alerts, restart policies, deployment validation, or backups. A monitoring interface should help reveal patterns, not normalize repeated manual restarts.
WhaleDeck presents current server and container information including state and resource usage, alongside logs and Docker resource relationships.
No. Use it for current inspection and management, and retain Prometheus, Grafana, or another observability stack for history and reliable alerting.
Yes. The iPhone app can connect to existing Docker hosts and provide current operational information and controls.
No. Running only describes the process state. Review health checks, logs, dependencies, and the actual application response.