
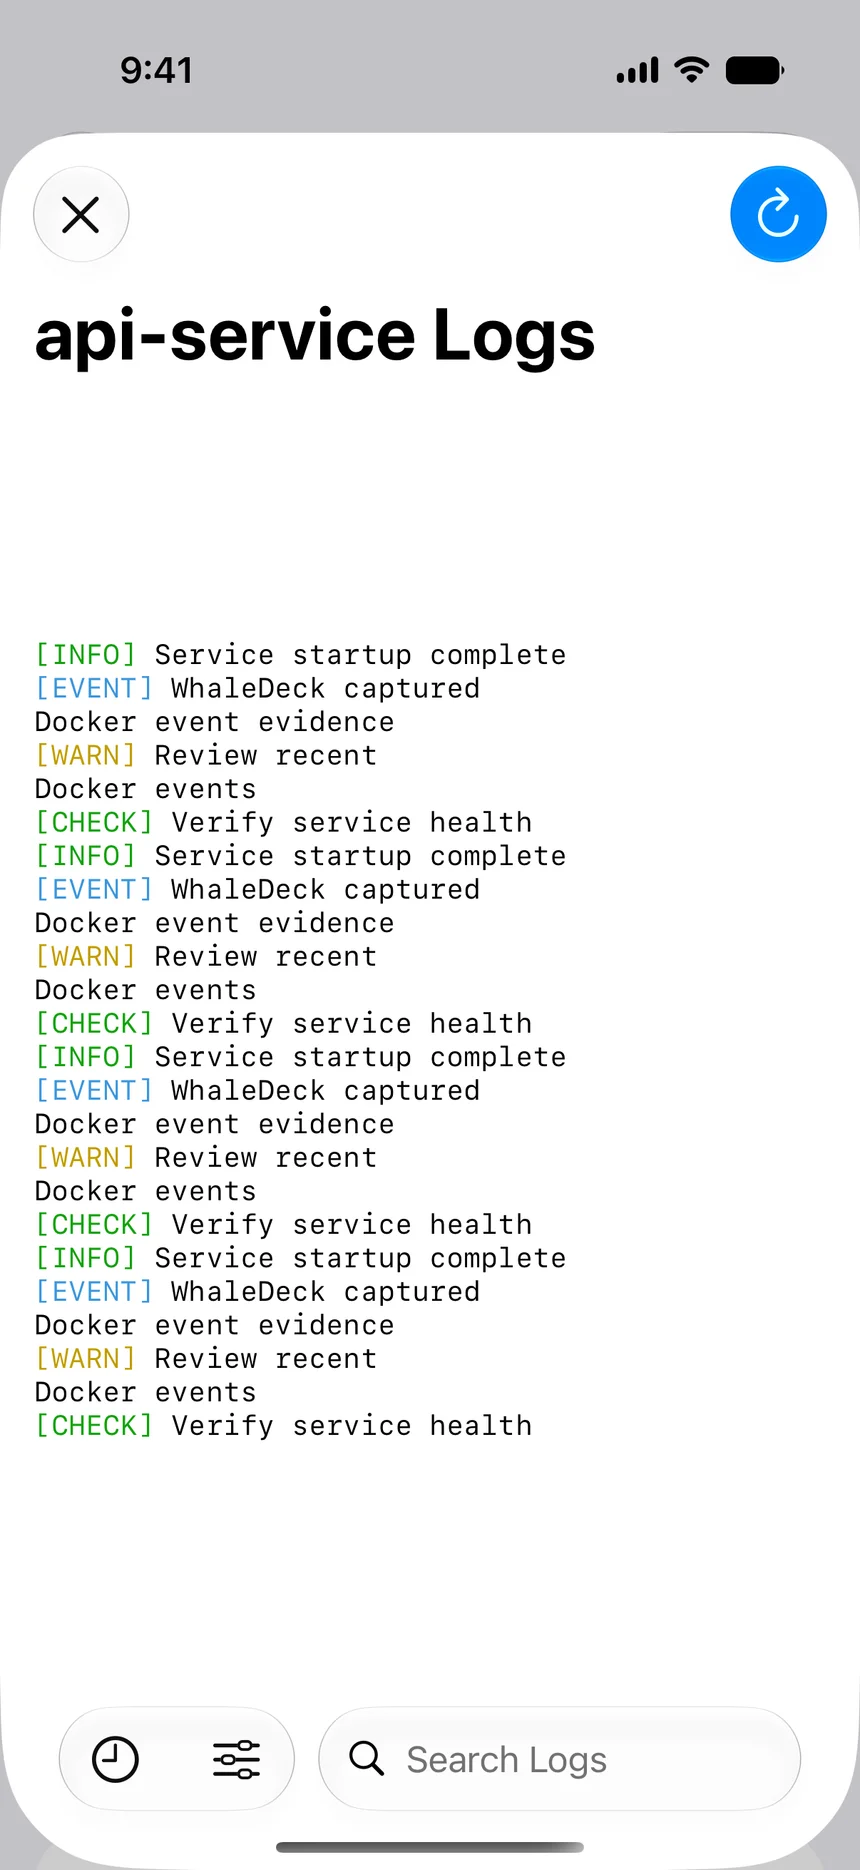

Recent output anywhere
Open the available Docker log stream from iPhone, iPad, or Mac without starting a remote terminal session.
Container logs
Read recent Docker container logs from iPhone, iPad, and Mac, then connect errors to state, resources, ports, mounts, networks, and dependencies.
Manage one server for free. Optional one-time Pro upgrade.
WhaleDeck provides a graphical Docker log viewer on iPhone, iPad, and Mac. It displays the recent stdout and stderr stream available from Docker and keeps the container state, resources, and configuration nearby for faster incident triage.
Logs are most useful when they are connected to the system that produced them. An isolated stream can show an error without revealing that the container is restarting, a volume is missing, or a dependency is unavailable.
WhaleDeck places recent Docker output inside the container management workflow. The same client can move from the log line to ports, mounts, networks, image, resource usage, and lifecycle actions, whether the investigation begins on an iPhone or continues on a Mac.
Open the available Docker log stream from iPhone, iPad, or Mac without starting a remote terminal session.
Compare output with state, restarts, resources, mounts, ports, networks, image, and dependencies.
Triage on a mobile device and continue deeper configuration work from a workstation when needed.
Docker normally captures what the container process writes to standard output and standard error. The available lines and timestamps depend on the application, image, logging driver, and daemon configuration. A graphical viewer presents that stream but cannot invent output the application never sent to Docker.
Some applications write to files inside the container or send data directly to an external logging platform. Some remote logging configurations disable the local cache used by the standard log endpoint. An empty view therefore requires investigation of the logging architecture, not an immediate assumption that the client failed.
Begin with the container identity, host, state, and time range. Work backward to the first relevant error before retries generate a large volume of secondary messages. Look for missing configuration, refused connections, permissions, storage, certificate, DNS, or memory failures.
Compare timestamps with deployments, host pressure, dependency outages, and user reports. Preserve useful evidence before restarting the process. A restart can be appropriate, but it often changes the context that explains why the failure happened.
A connection error may point to another container on the network. A permission error may involve a mounted path. A startup failure may follow an image change. Open the related resource details and test the most plausible cause instead of treating every log message as an isolated application bug.
After any action, return to the logs and verify startup. Then test health and user-visible behavior. A running process that continues to emit errors has not recovered simply because its lifecycle state changed.
A native log viewer is ideal for current operational context. It is not designed to replace indexed retention across many services. Long-term search, request correlation, dashboards, compliance retention, and audit trails belong in a dedicated logging system.
Use WhaleDeck as the fast first layer. It can tell you whether the issue is obvious, whether another Docker resource is involved, and whether the incident can be handled safely from the current device.
Yes. It can display recent container output made available by the connected Docker host.
The application may log to files, an external service, or a driver configuration that does not provide a readable local cache.
No. Container output and host daemon logs are different sources and may need different tools.
No. It is suited to current log inspection; use a logging platform for retention, broad search, correlation, and audit requirements.