
Server status first
Review host availability and current resources before assuming one container is the root cause.
Server overview
Use a native Docker server dashboard to review host status, current resources, container state, logs, and dependencies from iPhone, iPad, and Mac.
Manage one server for free. Optional one-time Pro upgrade.
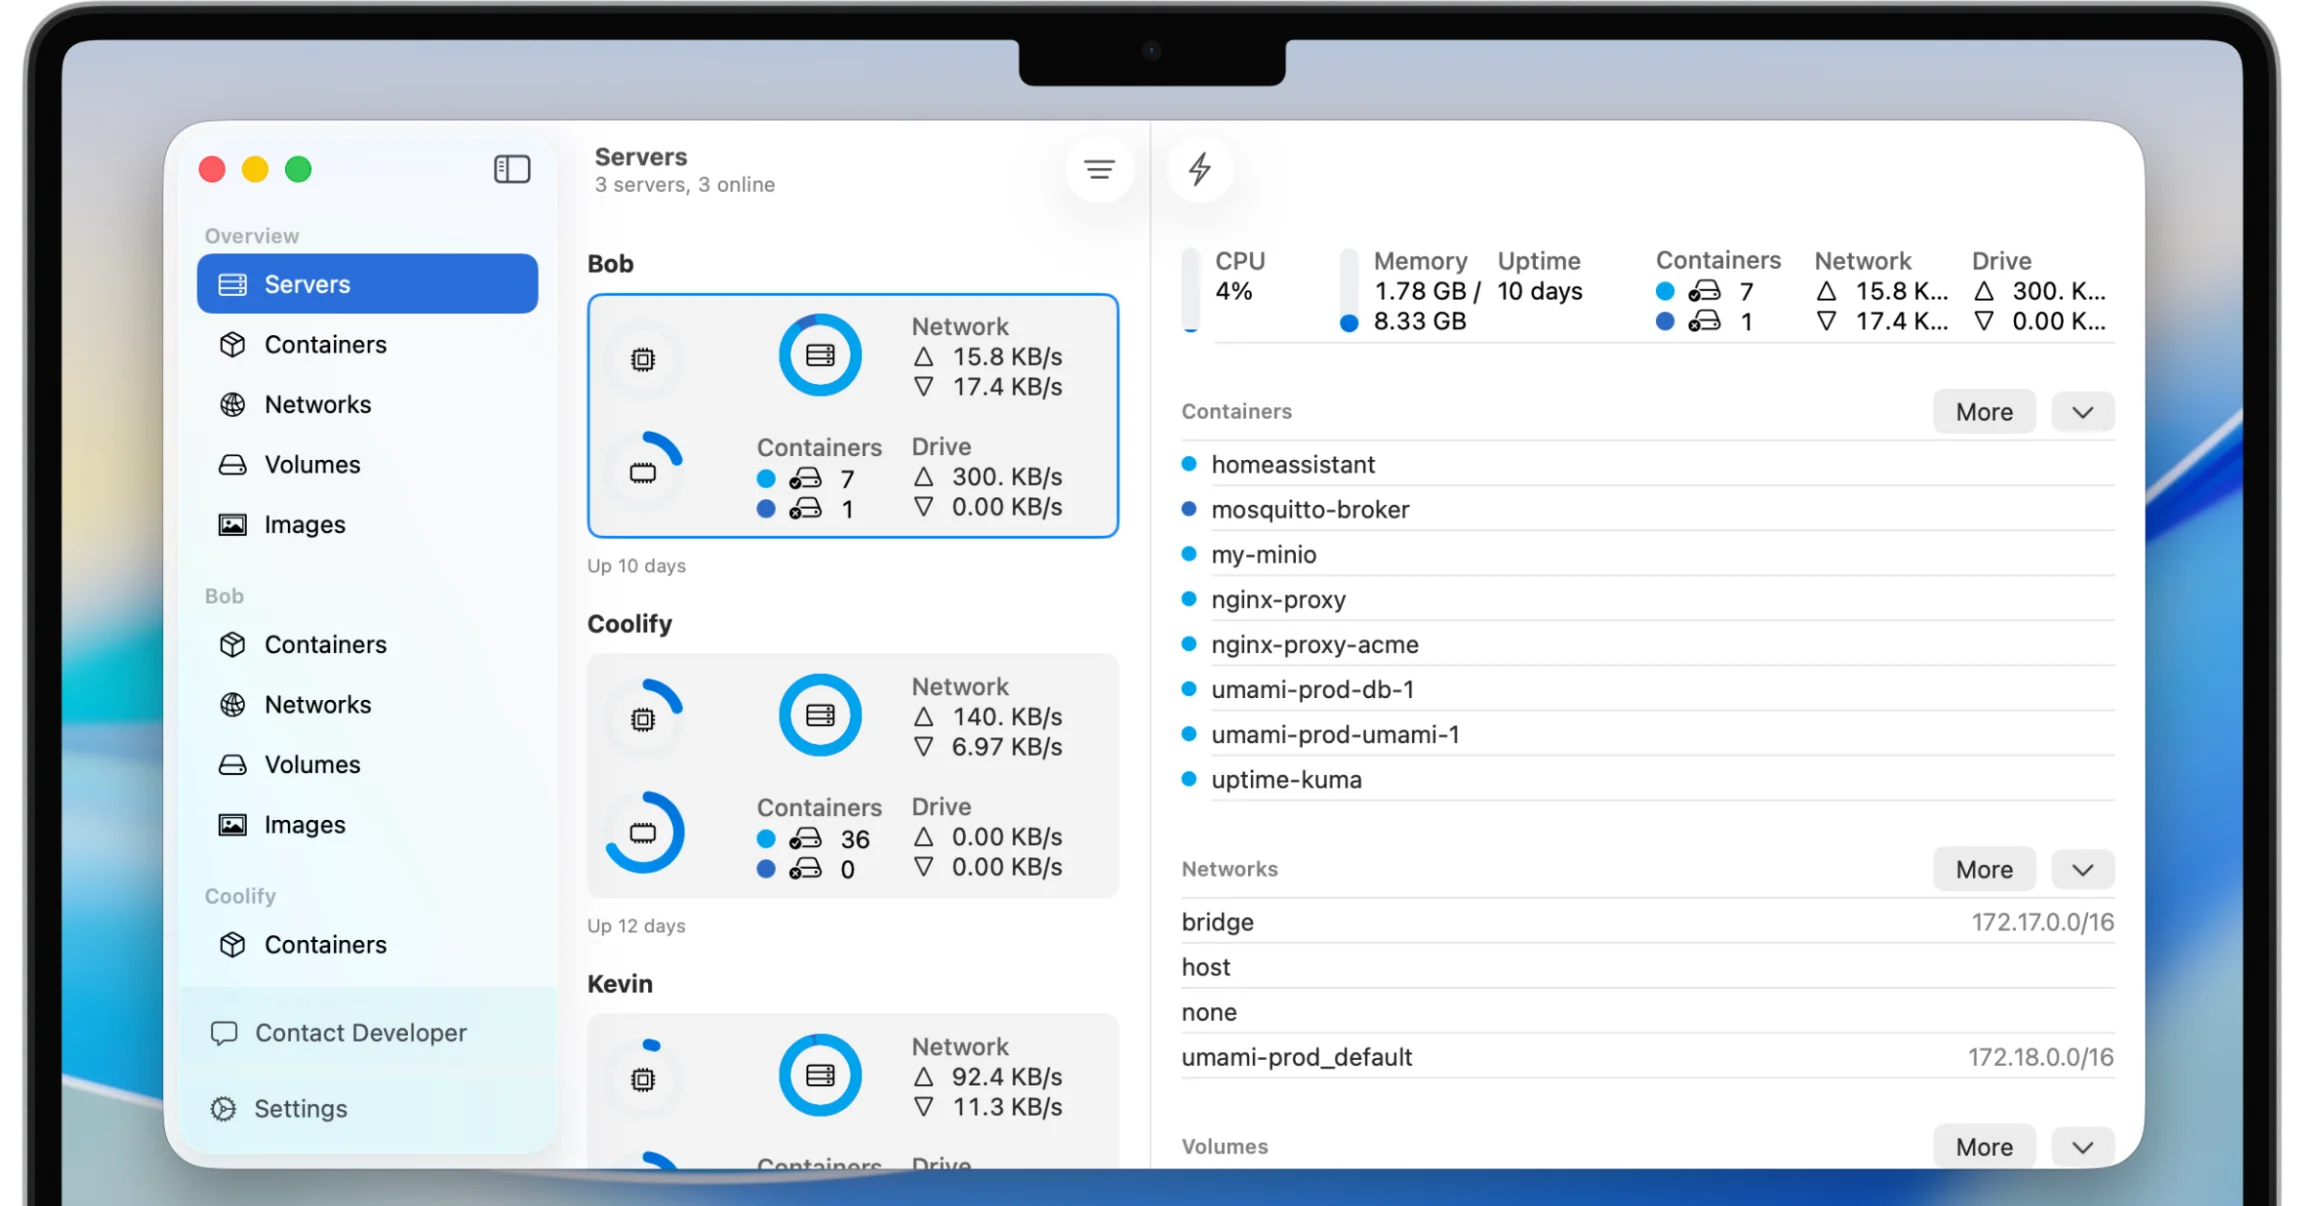
WhaleDeck is a native Docker server dashboard for iPhone, iPad, and Mac. It combines host resource information with container state and resource relationships, then provides direct navigation into logs and management actions for current operational work.
A useful dashboard does more than decorate metrics. It should tell an operator whether the host is reachable, whether capacity is constrained, which containers changed state, and where to investigate next. Information that cannot lead to a decision quickly becomes noise.
WhaleDeck organizes the Docker host and its resources into a native Apple-platform interface. The server overview is the starting point, while container, image, network, volume, and log views provide the detail required for action.
Review host availability and current resources before assuming one container is the root cause.
Move from server overview to container state, logs, ports, mounts, networks, images, and lifecycle actions.
Use a compact iPhone view, spacious iPad experience, or full Mac workspace according to the situation.
Is the server reachable? Is storage, memory, CPU, or network activity unusual? Are containers exited, restarting, or paused? A dashboard should answer those questions before adding dense charts. WhaleDeck prioritizes the current state of the Docker environment and the path to detailed resources.
Current values are evidence rather than conclusions. High CPU may be expected during a build, while moderate storage use may be dangerous if a volume is growing without retention. Interpret metrics against the role and normal behavior of the host.
When a container changes state, inspect its logs, resource use, restart policy, image, ports, mounts, and networks. If several services fail together, return to host health and shared dependencies. The dashboard should support movement between these levels instead of presenting isolated cards.
WhaleDeck brings the resource graph into one product. That reduces command switching and makes it easier to explain why an action is appropriate before it is taken.
A dashboard is visible only while someone is looking at it. Reliable monitoring probes services, stores history, and sends notifications. WhaleDeck is the current-state management interface that an operator opens after receiving that signal or during a planned check.
Use widgets for glanceable awareness and a monitoring platform for guaranteed alerts. Use WhaleDeck to investigate the Docker state, read current logs, understand dependencies, and perform controlled actions.
The iPhone emphasizes fast checks and direct navigation. The iPad can remain visible as a portable status display while offering enough space for deeper inspection. The Mac supports extended work beside development, monitoring, and configuration tools.
A consistent resource model reduces handoff cost. The operator can begin on one device and continue on another without learning unrelated navigation or terminology.
It provides current server and Docker resource views, including container state, resources, logs, images, networks, and volumes.
Yes. WhaleDeck connects to existing Docker environments and presents them through the native client.
No. A dashboard presents information; monitoring actively probes, retains history, and alerts when nobody is watching.
WhaleDeck provides platform-specific native interfaces around the same Docker management model.