
Guide · 7 min read
How to monitor Docker containers on an iPad
Set up a practical iPad dashboard for Docker status, CPU, memory, logs, ports, and server capacity without turning monitoring into a wall of noise.

typ0genius · Published
In short
An iPad can monitor Docker by connecting a management client to the remote engine, then organizing checks around server capacity, container state, resource trends, and recent logs. Use the larger screen for side-by-side context, but keep alerting and historical metrics in dedicated monitoring systems.
An iPad sits between a phone and a desktop: it is portable enough for quick checks but large enough to compare server and container details without constant navigation. That makes it useful for operational triage, especially when a full workstation is not available.
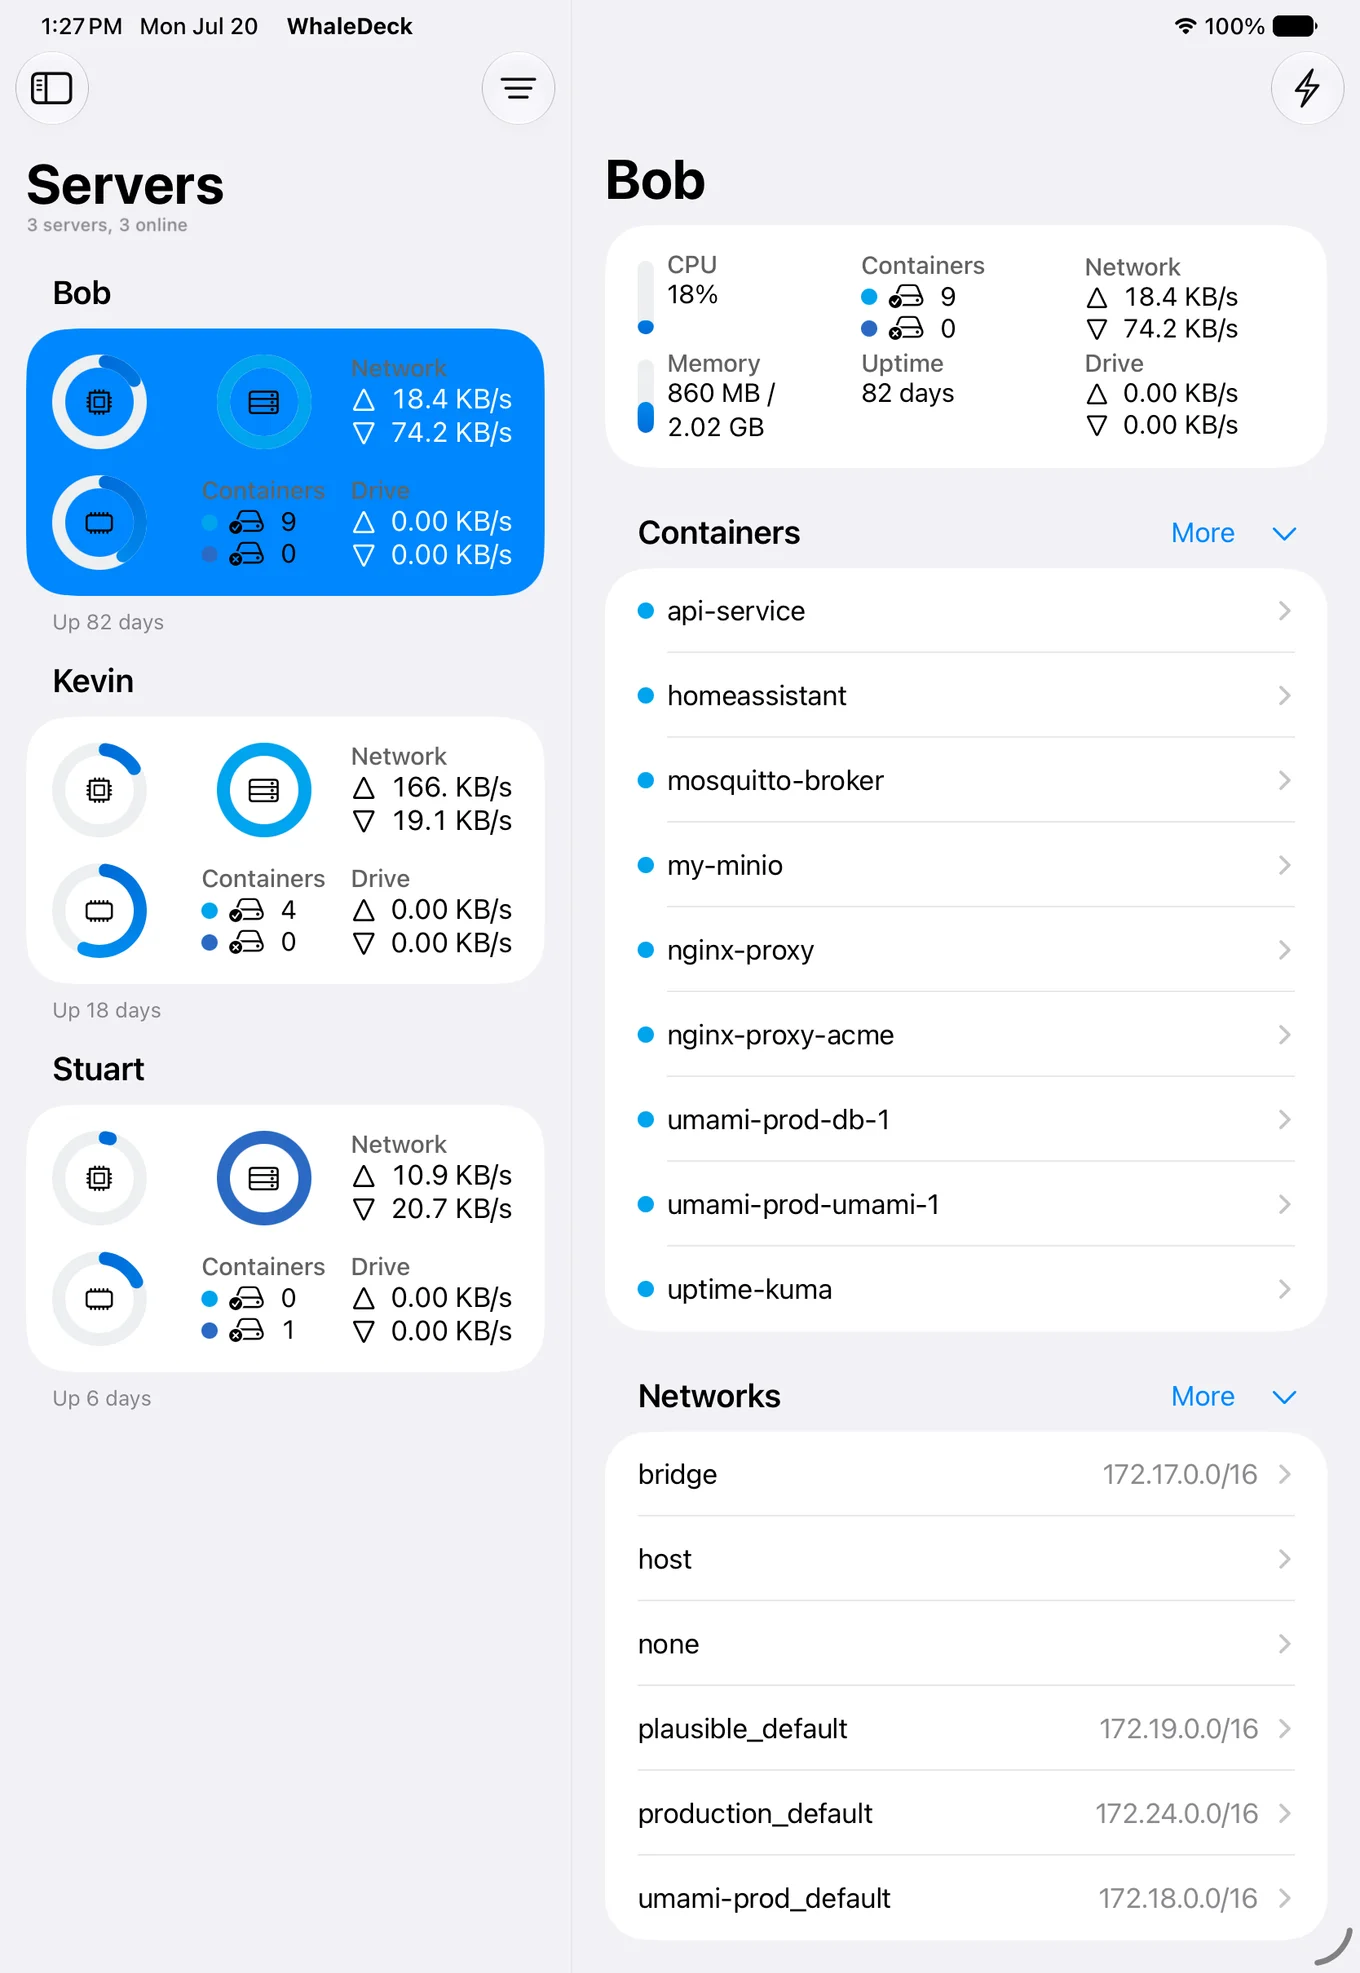
A Docker client such as WhaleDeck can show current resource values and lifecycle controls, but it should complement rather than replace long-term metrics and alerting. The strongest setup uses the iPad for investigation and action while a monitoring system detects incidents, stores history, and sends notifications.

Design the dashboard around decisions
A useful dashboard should answer a sequence of questions. Is the host reachable? Is the host under CPU, memory, storage, or network pressure? Which container changed state? Is the problem isolated or shared by several services? Recent resource values are evidence, but they need context from status, dependencies, and logs.
Avoid treating every high value as an incident. A build container may legitimately use all available CPU for a short period, while a database using stable memory may be healthy. Compare current values with the expected workload and use historical monitoring when you need to distinguish a spike from a trend.
Follow a consistent investigation order
Begin at the host level and verify connectivity, uptime, available storage, memory, and aggregate load. Next, sort or scan containers by state. For the affected service, inspect its restart policy, recent state changes, mapped ports, mounted volumes, and connected networks. Finish with logs and the state of upstream dependencies.
This order prevents tunnel vision. A container can appear unhealthy because the host disk is full, because DNS is unavailable on its network, or because a mounted path is missing. Restarting only the visible container may add churn without resolving the shared cause.
- Host reachability and capacity.
- Container state and recent lifecycle changes.
- Resource usage relative to the workload.
- Ports, volumes, networks, and dependencies.
- Recent logs and post-action verification.
Use iPad features without losing operational discipline
Widgets can keep a small set of important servers or containers visible on the Home Screen. Spotlight can shorten navigation when you already know the target name. Shortcuts can automate a carefully scoped routine. These integrations reduce friction, but every action should still make the target and outcome clear.
For a shared or production environment, document when mobile actions are allowed and when a workstation is required. Require a backup or rollback path for stateful services, and avoid destructive cleanup when the iPad view does not provide enough context to verify ownership.
Frequently asked questions
Can an iPad replace a full Docker monitoring system?
No. It is a useful client for current operations, but long-term metrics, alert rules, retention, and incident history belong in a dedicated monitoring system.
Which Docker metrics should I check first?
Start with host availability, storage, memory, and CPU, then inspect container state, restarts, resource usage, and recent logs in that order.
Are iPad widgets suitable for alerts?
Widgets are suitable for glanceable status. Use a notification or monitoring service for reliable alert delivery and escalation.